BRAVO5
Replay the day, and ask it questions afterwards.
BRAVO5 records the traffic picture and lets you scrub back to any second of it — with the separation events already found, the complexity already scored, and the wind field reconstructed from the aircraft themselves.
Replay
Scrub to the second, at up to five times speed.
Pick a date and a time, or drag the timeline. Play, pause, skip in 30-second steps, and run at 1×, 2×, 3× or 5×. Measure the distance between any two aircraft, or ask for their closest point of approach.
- Near-real-time feeds and delayed file drops replay identically
- Position retention is configurable per data source
- Runs in a browser — nothing to install on an analyst's machine
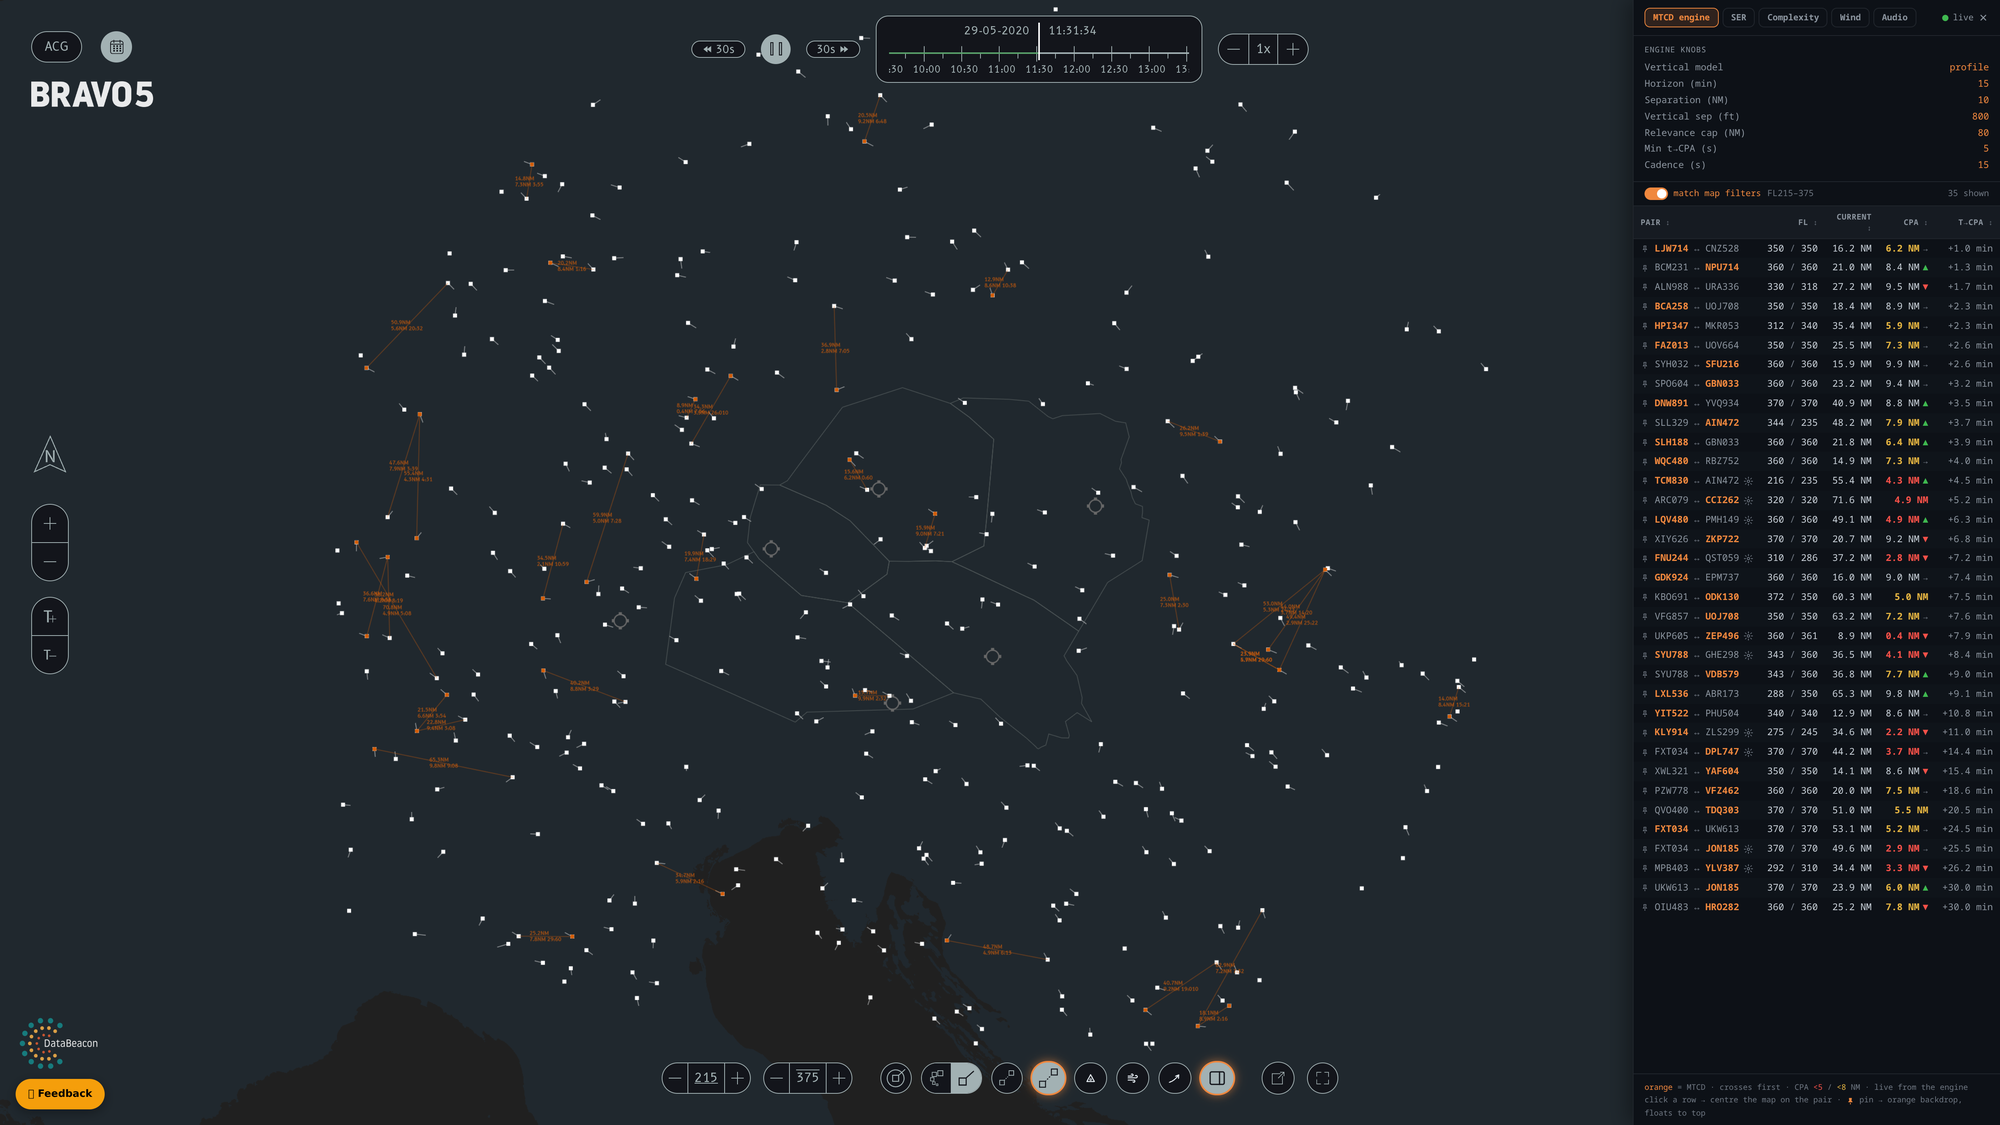
The side panel
Four ways to interrogate the same moment.
Some of it is precomputed overnight so it is there the instant you open the day. The rest is worked out live, in step with the replay clock, while you watch.
SER
Safety events, already found
Separation events located by an overnight job. Each row pairs two callsigns with their flight levels, how close they actually came, the applicable minimum, the time and the duration. Click a row and the replay jumps to that moment.
MTCD
Conflicts predicted as you play
Projects every aircraft forward on its current track and vertical profile and draws the crossings it expects — before they happen. Recomputed continuously against the replay clock.
Complexity
Demand and complexity by day
Flights, conflicts, manoeuvres and level changes per day with an average complexity score, tinted against the mean and trended day over day.
Wind
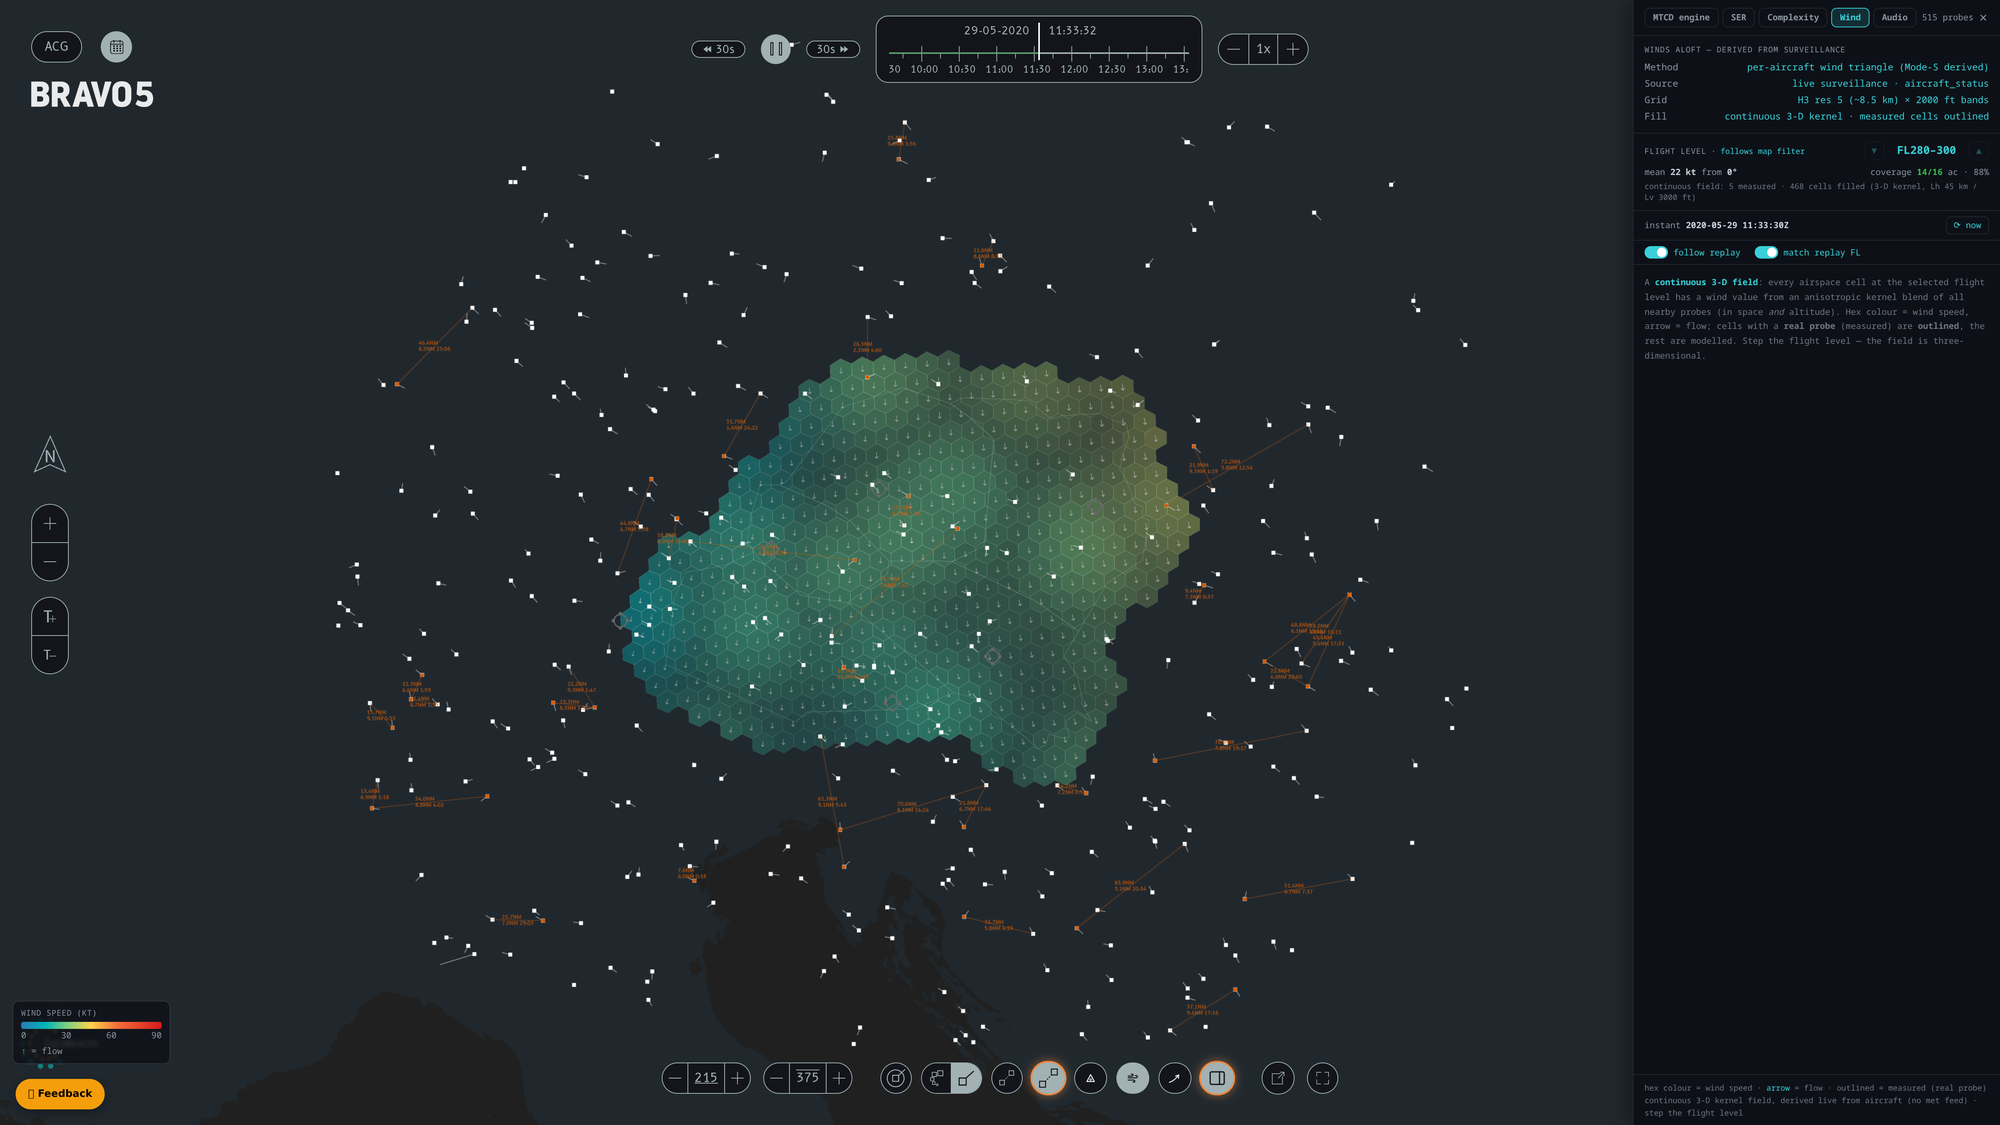
The wind field, from the traffic
No weather feed. Step through it by flight level and it follows the replay clock.
Worth explaining properly
Every aircraft is a wind sensor.
An aircraft crabbing into a crosswind tells you the wind. Surveillance data gives both where the nose is pointing and where the aircraft is actually going; the difference between those two vectors is the wind at that point and level.
Thousands of aircraft become thousands of probes, smoothed into a three-dimensional field you can step through by flight level and read out cell by cell — reconstructed from the traffic itself, with no meteorological feed involved.
Reading a separation event
Actual separation against the minimum that applied.
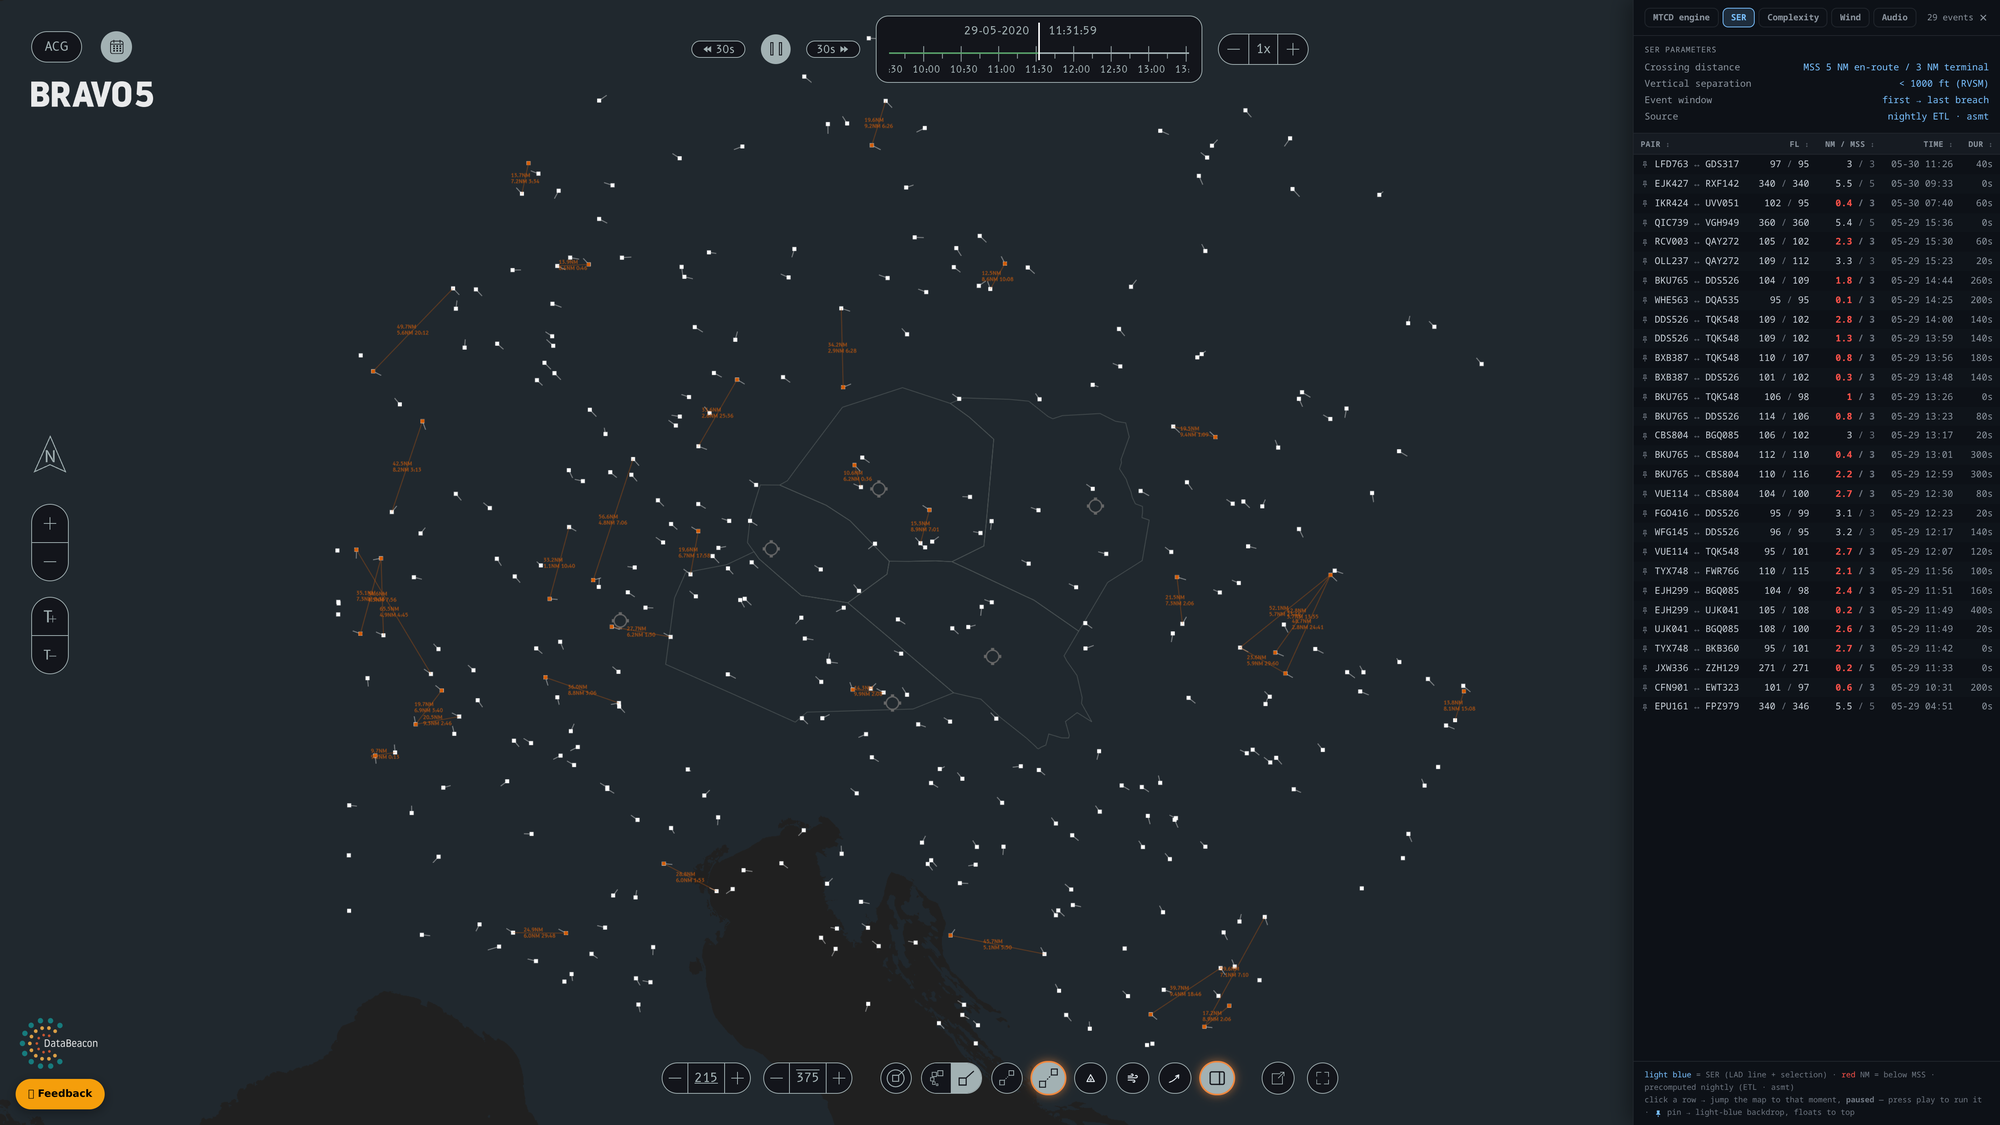
Each event shows the distance the pair actually reached at closest approach alongside the minimum
standard separation for that airspace — 5 NM en route, 3 NM terminal. So 2.7 / 3
reads as "they closed to 2.7 nautical miles where 3 were required", and the figure turns red when it
falls below the minimum.
Events at or above the minimum stay in the list rather than being filtered out: a 5.2 NM encounter is still worth a controller's attention. The panel states the criteria it applied — crossing distance, vertical separation and the event window — so the list can be audited rather than taken on trust.
At this scale
Measured on live feeds.
Figures measured on DataBeacon infrastructure carrying live radar and ADS-B feeds, August 2026. They describe the platform in operation, not a contracted service level.
What it is for
Post-operational analysis, not a control tool.
BRAVO5 is used after the fact — safety investigation, post-operations review, training and capacity analysis. It reconstructs what happened and shows the evidence behind each finding, so a review starts from the moment itself rather than from a description of it.
| Inputs | Terrestrial ADS-B and Mode-S, and ASTERIX CAT062 radar. Near-real-time streams and delayed file drops are both supported |
|---|---|
| Replay window | Configurable per data source |
| Playback | Second-level scrub, 30-second skip, 1× to 5× |
| Analysis | Separation events, predicted conflicts, complexity scoring, derived wind field |
| Delivery | Browser-based, hosted by DataBeacon |
Bring us a day you want to understand.
We will replay it back to you with the events, the complexity and the wind attached.